10 Business Intelligence Metrics Your Application Development Teams Should Have
Business Intelligence for Application Development
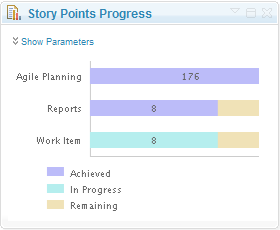
Story Point Progress
 This metric is probably the easiest to create, and the easiest to get horribly wrong if your tools are not integrated. Very simply, when doing a project using an agile methodology like Scrum, you should be able to determine a team’s progress as they complete story points, which in a nutshell are small descriptive paragraphs that describe some feature of a system from the perspective of a user. This bar graphs gives you a relative amount of completion based on the numbers of stories completed, vs, those in progress, vs. those remaining. This is based only on the quantity of stories, not the amount of work required per story. This is where other metrics come into play below.
 Burn Down Charts
 One of the first metrics, is the Burndown chart. Very simply, it should show, over time, a gradual downward slope as open tasks (or work items) are completed. The Burndown chart is very common in Scrum methodology, as it gives the executive team a high level picture of where the project is in its lifecycle, and how fast the development is going. For example in this picture, we see an early rise in slope, as the requirements and tasks are first created. If that is all we saw, then we would know the project is in its early phases. We can tell the general velocity of the team by the downward slope. As the slope approaches vertical, the team is accelerating in their velocity. As it approaches horizontal, they are stagnating (either due to longer than estimated story points, and defects).
 Open vs. Closed Work Items
 This chart, is a good first stop for a project manager. The next stop is to look at open vs. completed or closed tasks. Over time, we should see an increasing slope on closed items, and a decreasing slope on open items. Items in progress in time should show a relative plateau as the team reaches their maximum work level, then drop off as all work items are resolved.
Open Items By Priority
Typically, a ScrumMaster or Project/Product manager would then want to drill down to see what types of work items are getting resolved. It may be fine if the number of closed items are getting larger, but is the team resolving the most important ones, or the low priority ones? This is where the next metric comes into play – open items by priority. When looking at this chart, the number of high priority items should be lower, and have a better downward velocity than for lower priority work items. This shows that the team is working on the right work items. A high priority task may be some thing that is required for future work items, some thing that prevents other features from working, or even is simply a high priority for the stakeholders such that the completed work items meets an important need such as a regulatory compliance.
Team Progress Report
 Another metric with meshes with the two prior is the progress report. When a team has estimated the number of minutes/hours/days for each task assigned, and you can accurately tell how many work hours are available for the team (based on holidays, vacations, etc), you can measure a projects overall progress. The progress report chart shows how much has been completed (in green), vs. where the team should be. A red bar indicates the team is behind their estimates (sometimes a sign of poor estimation). When the chart shows a lighter color green on the right it would mean that the team is ahead of schedule, as they have completed work items in less time than estimated. In order to achieve accuracy, however, the data flowing into the system must be accurate. As the saying goes, “garbage in – garbage out”. You must have an accurate report of how many hours a team member is available for the project. What is their % utilization going to be? If you expect 100% and they are actually assigned to another project for 25% of the time, you’re going to get less than accurate estimations. Also, its important to accurately estimate how long a task will take. Again, if you are getting this information by word of mouth, through spreadsheets, or email, then the accuracy of the report is going to be less than desirable. It is important that the tools that you use integrate together to give you real time, live data. Depending upon your team to give you estimates that you have to manually collect, and then making assumptions on their availability is not going to give you accurate data!
Team Velocity
 While I mentioned team velocity earlier, I only alluded to understanding it relative to other metrics. Providing that your project management software is integrated with bug/defect tracking and your source code system, you can report directly on the team’s actual project velocity. By that we look at the number of story points or work items closed per iteration. This metric will be affected by the number of developers and their availability for each iteration. It also is reflective of the skillset of the team. A more highly skilled team, in theory, should have a higher velocity than a less skilled team. By looking at the velocity over several iterations, you can more accurately estimate actual project completion times. This in turn gives better data to the financial stakeholders so that they can best understand what their true investment will be in the end.
 File Change Activity
 Another way to tell how much work is going into the system is to determine what level of chaos is going on with the source code. By that I mean the amount of change and new source code. When a project is new, there is likely lots of new source code, and lots of file activity. This change creates a level of chaos. As more files change, more potential defects are introduced to the system (the corollary of this statement means that the less code, less chaos, and zero code means zero chaos – which also means zero progress). Over time, as the level of chaos settles, we should expect less file changes, and thus expect less defects. Using Test Driven Development (TDD), should also help keep regression errror under control. As a project nears completion, we should see less and less file change activity as the team focuses more on bug/defect remediation rather than new feature development. The file change activity report can give you this level of reassurance when your project starts into its final iterations.
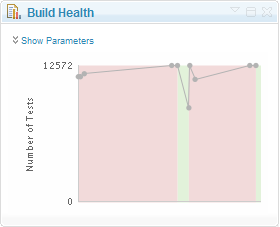
Build Health
 Your application development project should be using build automation. If not, then you probably enjoy mowing your grass with scissors. I won’t go too much on a soap box on why you need build automation, but suffice it to say, it removes manual configuration errors, reduces the amount of time required to compile, package, and deploy your product, and frees up your team to do more important work. Some organization use open source tools like Cruise Control, Hudson, or Jenkins, etc. All of which can give you statistics on an individual build. You do want to know what the result of the build was for a specific point in time, but you should also be looking at build health over a history of time. One of the tenants of build automation is frequent or continuous builds. This means that when someone checks in code, an integration build script kicks off and runs unit tests to ensure that the project can be properly compiled, tested, and packaged. If over time the build health shows lots of errors this can be indicative of poor team discipline in creating unit tests to prevent regression errors from coming into the system. You may also be able to prevent a developer from delivering code to the team stream without first running a unit test, or ensuring a certain level of code coverage.
Code Coverage Report
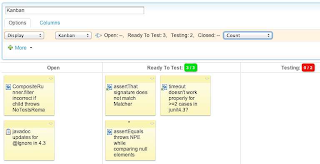
Kanban Report
 Not exactly a great name for a report, but as mentioned earlier, a Kanban report can help you determine what resource capacity you have available, and if you are exceeding your target limits. You need to be able to see what you’ve got from a resource utilization perspective, and answer questions such as:
- Who is not fully utilized?
- Do I have capacity to complete a few extra tasks?
- Who is not pulling their weight?


Where it really gets interesting is when we can tie these technical metrics to true line of business outcomes. These technical project metrics can be forward looking predictors of the risk quotient a software investment is facing. Correlating the two concepts you can see how changes in the project risk actually impact the company's bottom line. Without the technical metrics, executives are just guessing at the return from the business outcomes.